1. Overview of Anomaly Detection Technology
Definition and Importance of Anomaly Detection
Anomaly Detection is a technology used to identify unusual patterns that differ from normal patterns within data. This technology is utilized in various fields such as defect detection in manufacturing, intrusion detection in cybersecurity, and early detection of diseases in medicine. Since anomalies differ from normal patterns, they require learning through machine learning or deep learning instead of predefined rules.
Role and Impact of the MVTec AD Dataset
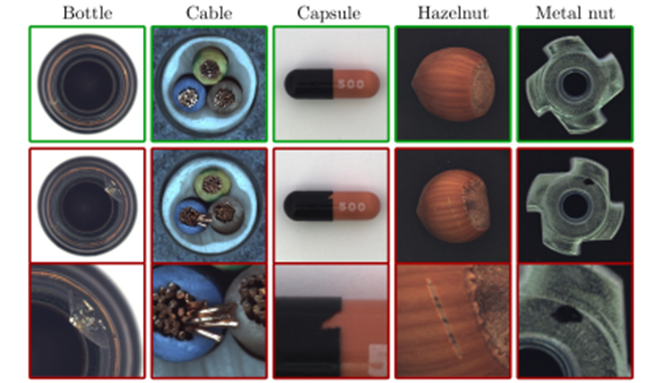
The MVTec AD dataset is specifically designed for anomaly detection in manufacturing. It includes images of various industrial products and serves as a crucial resource for learning the differences between normal and abnormal products. MVTec AD not only promotes the development of highly accurate anomaly detection models but also serves as a widely used benchmark for evaluating new methods.
Recent Trends in Anomaly Detection Technology
Recently, anomaly detection technology has evolved significantly, with the emergence of more advanced and efficient methods. Particularly, with the advancements in deep learning technology, there have been significant improvements in the accuracy and speed of anomaly detection. The following latest methods, especially those using the MVTec AD dataset, have demonstrated superior performance.
Previously, supervised learning was predominant, but recently, unsupervised learning methods that detect anomalies from unlabeled data and semi-supervised learning methods have gained attention. Additionally, techniques for real-time anomaly detection using lightweight models and anomaly localization that accurately pinpoint the locations of anomalies have also developed.
2. SPADE: Sub-Image Anomaly Detection
Technical Overview of SPADE
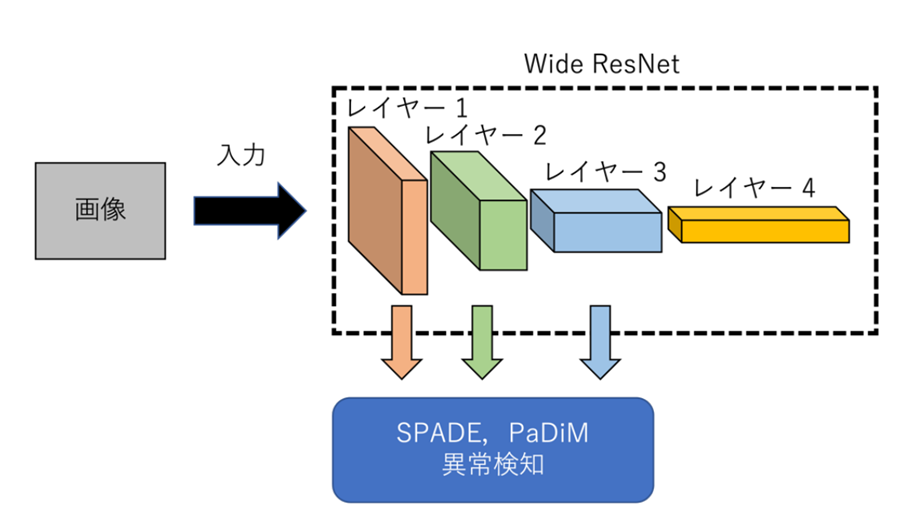
SPADE (Sub-Image Anomaly Detection with Deep Pyramid Correspondences) uses a deep learning approach to learn correspondences between sub-images for anomaly detection. It models the relationships between patches (sub-images) within normal images to detect anomalies.
A key feature of SPADE is its use of a deep pyramid structure to analyze images at multiple scales, effectively capturing anomalies at different resolutions. By mapping the features of each region in the image in a deep feature space, it can also detect minute anomalies.
Using Deep Pyramid Correspondences
Deep Pyramid Correspondences analyze images at multiple resolutions, learning the relationships between image patches at each resolution. This process detects anomalies as follows:
- Feature Extraction: Extracts multiple layers of features from the input image, obtaining both low-level and high-level features.
- Pyramid Matching: Compares feature maps at different scales, learning the correspondences in normal images. These relationships help identify anomalies in test images.
- Anomaly Scoring: Calculates the misalignment of correspondences for each patch in the test image and evaluates this misalignment as an anomaly score.
SPADE has shown high detection capabilities, particularly in defect detection in manufacturing, not missing any fine defects.
Achievements in MVTec AD
SPADE has demonstrated excellent performance in the MVTec AD dataset, capable of high-precision anomaly detection and successfully identifying minute defects in products. Compared to traditional methods, SPADE achieves high anomaly detection accuracy and localization performance, attracting significant attention from researchers.
3. Gaussian-AD: Modeling the Distribution of Normal Data
Basic Approach of Gaussian-AD
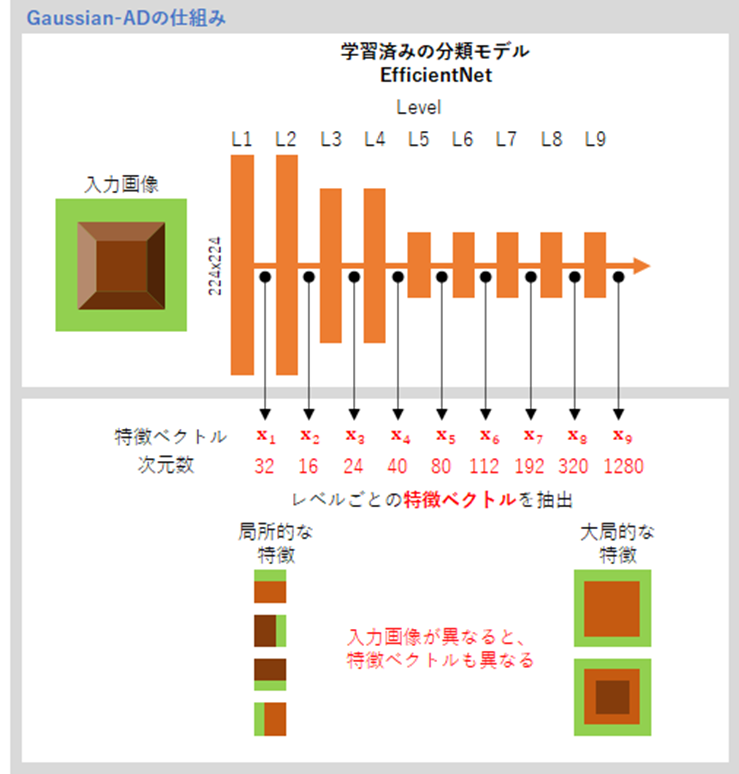
Gaussian-AD (Modeling the Distribution of Normal Data in Pre-Trained Deep Features for Anomaly Detection) uses pre-trained deep learning model features to model the distribution of normal data as a Gaussian distribution to detect anomalies. The main goal of this method is to use the statistical characteristics of normal data to detect anomalies.
Specifically, it uses pre-trained models (such as ResNet or VGG) to extract image features and approximates the distribution of normal data as a Gaussian distribution based on these features. Anomaly scores are calculated by measuring how much test data deviate from this normal distribution.
Using Pre-Trained Deep Features
Gaussian-AD effectively detects anomalies in unlabeled data by using features from pre-trained deep models. The anomaly detection process is as follows:
- Feature Extraction: Inputs normal images into a pre-trained deep model to extract feature vectors, which represent a high-dimensional representation of the images.
- Gaussian Distribution Modeling: Calculates the mean vector and covariance matrix based on the extracted normal data feature vectors to model the normal distribution.
- Anomaly Score Calculation: Inputs test images into the same deep model to extract feature vectors and calculates the Mahalanobis distance from the normal distribution, with larger distances indicating anomalies.

Source: https://qiita.com/makotoito/items/39bc64d30ce49a9edad8
Strengths and Weaknesses of the Method
Strengths:
- Versatility: Utilizes pre-trained models, making it applicable to various types of data.
- Efficiency: Leverages deep learning model features to enhance the accuracy of anomaly detection.
Weaknesses:
- Model Dependence: The performance depends on the features of the model used for feature extraction, making the selection of pre-trained models crucial.
- Limitations of Nonlinearity: The assumption of Gaussian distribution may not always be accurate, posing potential constraints for complex data.
Gaussian-AD is particularly notable for effectively detecting anomalies in unlabeled data, leveraging pre-trained deep models.
4. PaDiM: Patch Distribution Modeling Framework
Architecture and Design Philosophy of PaDiM
PaDiM (Patch Distribution Modeling) detects anomalies by dividing images into patches (small regions) and modeling the distribution of each patch. This approach is designed to enhance the accuracy of anomaly localization.
The basic idea of PaDiM is to extract features from each patch and model these features as a normal distribution. This model learns the feature distribution of normal data patches and evaluates how much new data deviates from this distribution to determine if it is normal or abnormal.
Success in Anomaly Detection and Localization
PaDiM excels not only in anomaly detection but also in anomaly localization. It detects and localizes anomalies through the following process:
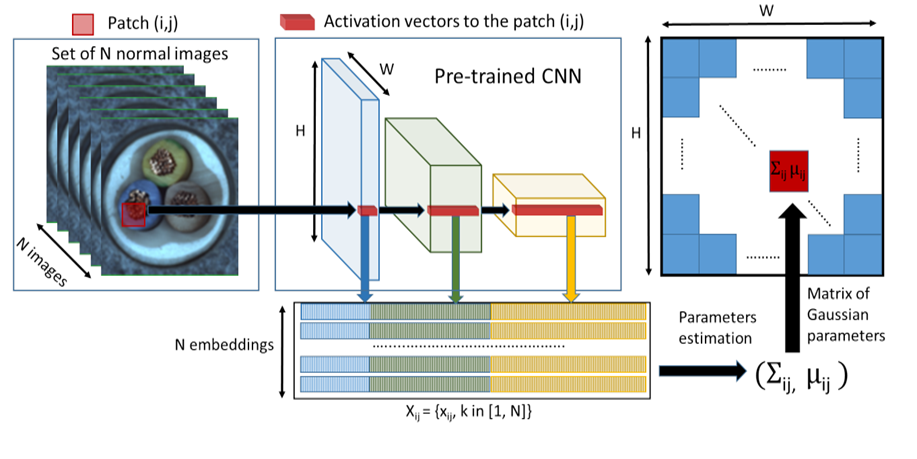
- Feature Extraction: Divides the image into patches and uses a pre-trained CNN (such as ResNet or EfficientNet) to extract features from each patch.
- Patch Distribution Modeling: Models the normal distribution using the feature vectors of each patch, learning the mean and covariance matrix for each patch.
- Anomaly Scoring: Similarly extracts features from the test image and evaluates how much each patch deviates from the normal distribution, calculating this deviation as an anomaly score.
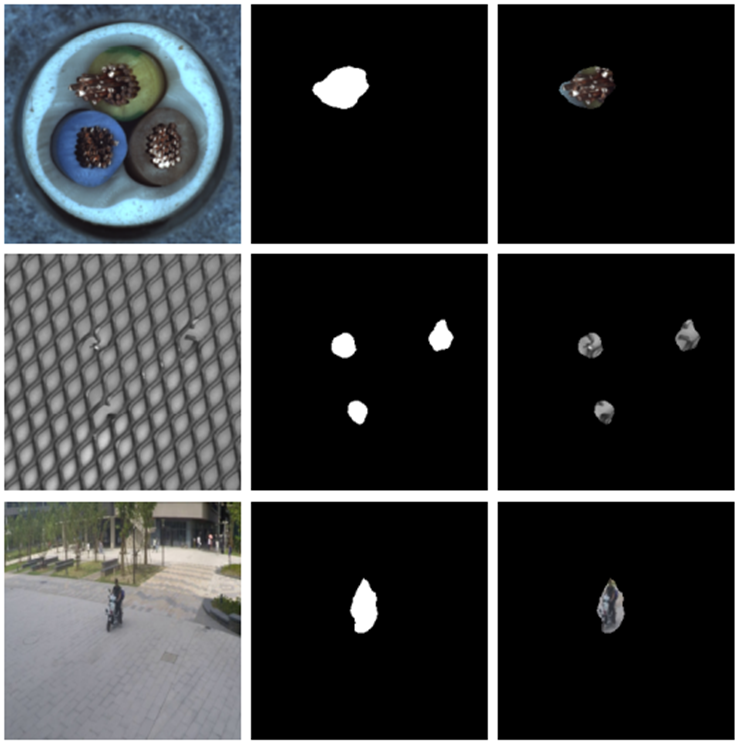
- Anomaly Localization: Uses the anomaly scores of each patch to identify the location of anomalies, generating an anomaly map that visually indicates which areas are abnormal.
Comparative Analysis: PaDiM vs. Other Methods
Strengths of PaDiM:
- High-Precision Anomaly Localization: Patch-level analysis allows for accurate detection of even minute anomalies.
- Utilization of Pre-Trained Models: Uses existing CNN models to enhance the efficiency and accuracy of feature extraction.
Comparison with Other Methods:
- Comparison with SPADE: While SPADE uses a multi-layered pyramid structure to detect anomalies at different scales, PaDiM excels in patch-level localization.
- Comparison with Gaussian-AD: While Gaussian-AD models the overall distribution of data, PaDiM captures the detailed distribution of each patch, making it superior in anomaly localization.
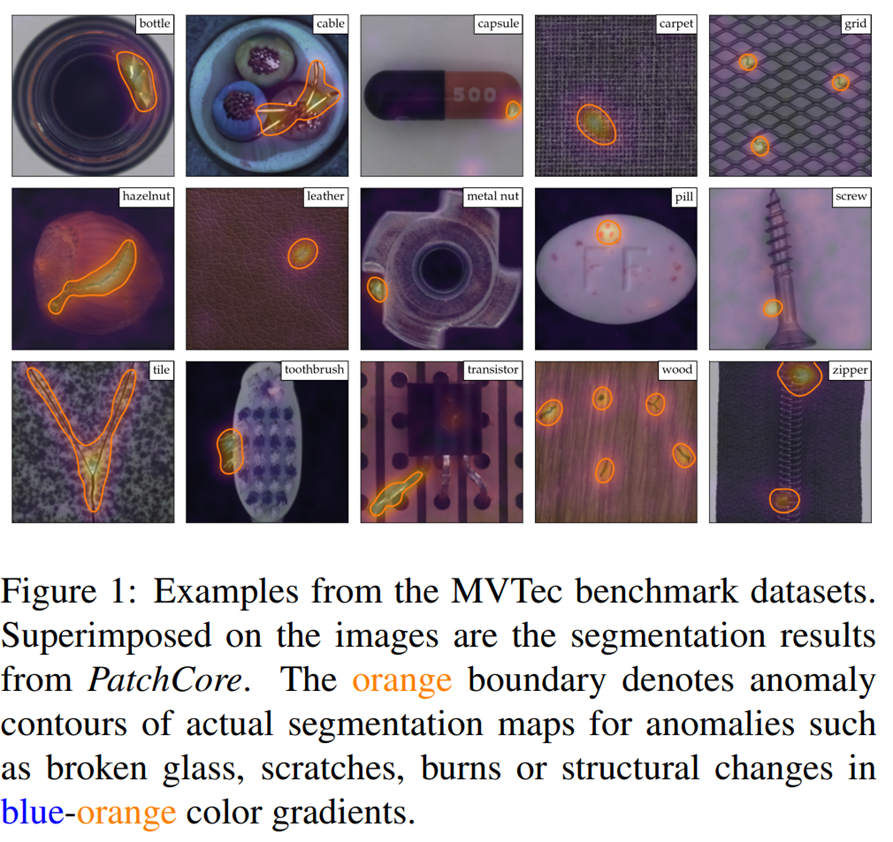
PaDiM is particularly noted in industries where anomaly detection is crucial, such as manufacturing, due to its high accuracy in anomaly detection and localization capabilities.
5. PatchCore: Pursuing Total Recall in Industrial Anomaly Detection
Goals and Methods of PatchCore
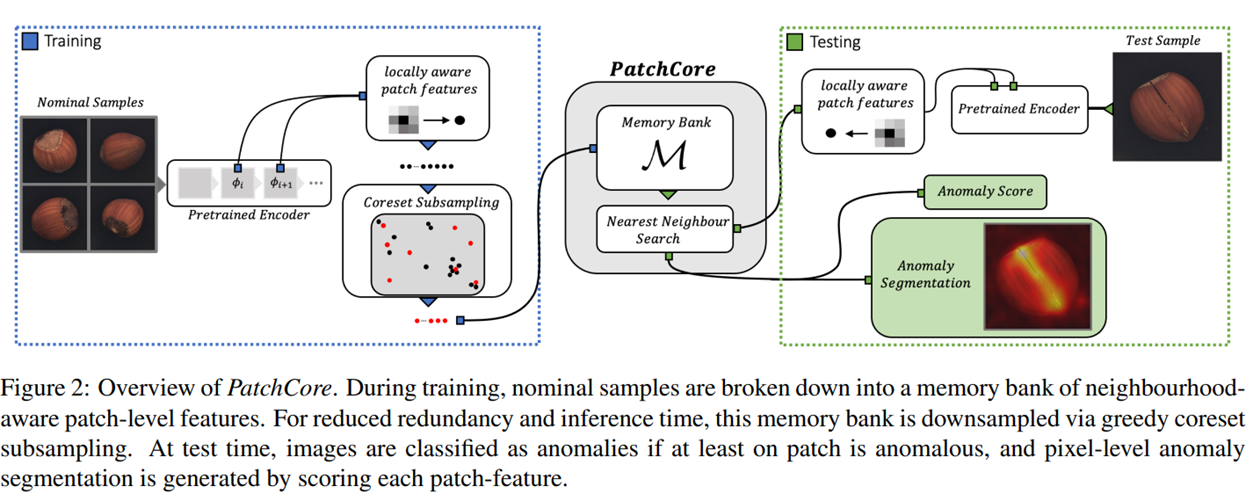
PatchCore is developed with the goal of "Total Recall," aiming to detect all possible anomalies, especially in industrial applications such as manufacturing. PatchCore focuses on utilizing query patches to detect patch-level anomalies in target images.
The main features of PatchCore include balancing memory efficiency and detection accuracy through a technique known as core-set selection. In core-set selection, only the most representative features from the feature space are chosen, allowing for efficient computation while maintaining high accuracy.
Implementing Total Recall
PatchCore detects anomalies and achieves Total Recall through the following process:
- Feature Extraction: Uses a pre-trained CNN to extract features from image patches, representing each patch in a high-dimensional space.
- Core-Set Selection: Selects the most important features from the extracted features through core-set selection, eliminating redundancy in the data space and reducing memory usage.
- Distance Calculation: Calculates distances between the core-set and patches in the test data, evaluating how much the test data deviates from normal data. Mahalanobis distance is used for anomaly scoring.
- Anomaly Map Generation: Generates an anomaly map based on the anomaly scores of each patch, identifying which areas are abnormal.
Real-World Applications
PatchCore has proven effective in numerous real-world applications, particularly excelling in the following
areas:
- Manufacturing: Used in production lines to detect defective products without missing fine defects.
- Quality Control: Ensures product quality by detecting anomalies in real-time at each stage of the manufacturing process.
- Security Monitoring: Utilized in security camera footage to identify suspicious activities or individuals.
PatchCore is highly regarded for its comprehensive anomaly detection capabilities and efficient use of computational resources, making it a popular choice across various industries.
6. AutoEncoder-SSIM: Evolution of Traditional Anomaly Detection Methods
Background and Purpose of AutoEncoder-SSIM
AutoEncoder-SSIM is an improved version of the traditional autoencoder-based anomaly detection method, incorporating SSIM (Structural Similarity Index) as a loss function that focuses on the structure of images. Autoencoders are neural networks that efficiently compress data and restore it to its original state, aiming to minimize the difference (loss) between input and output data.
The purpose of this method is to emphasize not only the pixel-by-pixel differences in image data but also the structural information that is meaningful to human vision, making it more effective at detecting anomalies including distortions and noise.
Effects of Incorporating SSIM
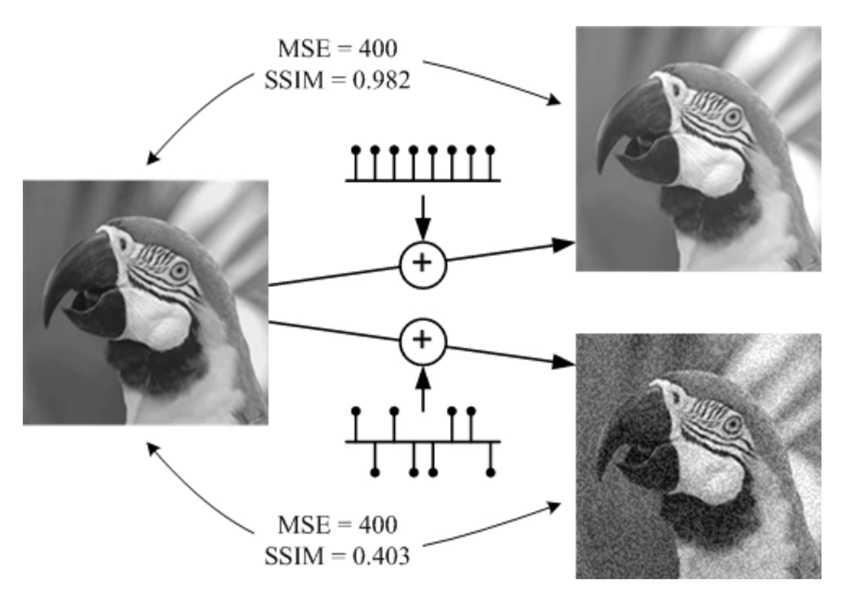
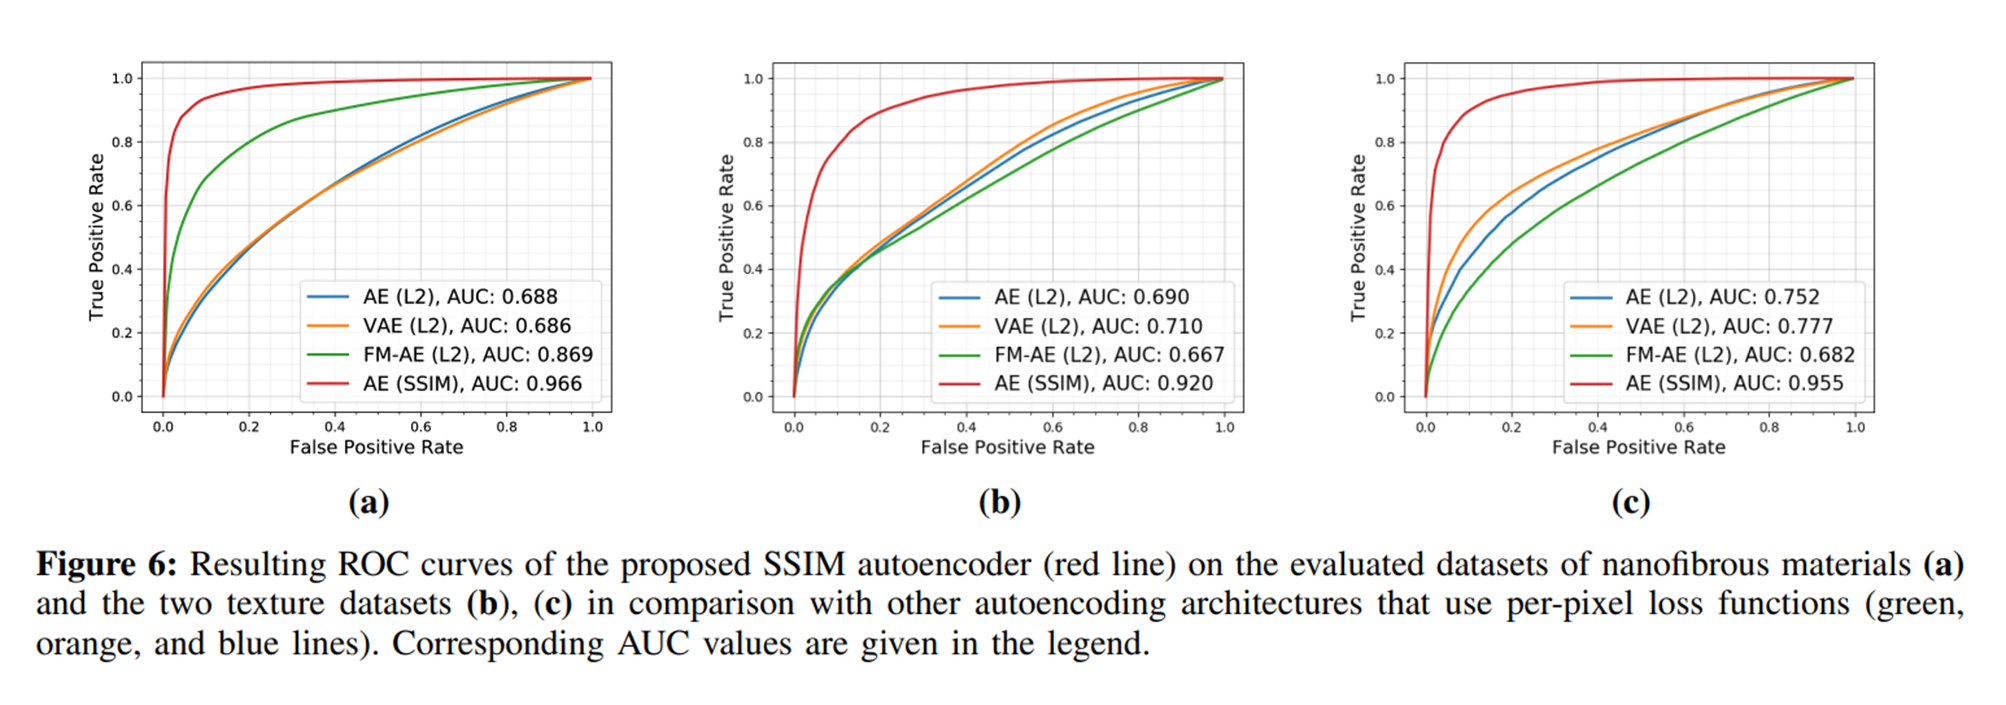
SSIM (Structural Similarity Index) evaluates the similarity between two images by considering their brightness, contrast, and structure. AutoEncoder-SSIM calculates the loss using SSIM between the reconstructed image and the original image, achieving the following effects:
- Emphasis on Structural Information: By considering not only the Mean Squared Error (MSE) at the pixel level but also the overall structure of the image, anomalies can be more accurately identified.
- Robustness to Noise: Since SSIM focuses on image structure, it is robust against noise and minor variations.
- Visual Interpretation: The method allows for anomaly evaluation that is closer to human vision, making the detection results more intuitively understandable.
Effectiveness of the Evolved Method
AutoEncoder-SSIM has proven its effectiveness in anomaly detection using the MVTec AD dataset, demonstrating higher precision in detecting anomalies compared to traditional autoencoder methods.
- High-Precision Anomaly Detection: The combination of autoencoders and SSIM allows for higher accuracy in anomaly detection compared to traditional methods.
- Real-Time Application: The computation is relatively lightweight, making it suitable for real-time anomaly detection, which is crucial in production lines and security monitoring.
- Historical Impact: AutoEncoder-SSIM represents a significant step in the history of anomaly detection, influencing many subsequent studies and accelerating the development of anomaly detection methods across various fields.
AutoEncoder-SSIM not only represents a technical improvement but also provides a new perspective in understanding and applying anomaly detection methods.
7. EfficientAD: Efficient Visual Anomaly Detection
Application of the Teacher-Student Model
EfficientAD is a method developed to balance computational efficiency and accuracy in anomaly detection, particularly by using a Teacher (Teacher)-Student (Student) model. This approach is designed to achieve lightweight and high-performance anomaly detection.
In the Teacher-Student model, a pre-trained large-scale Teacher model provides features that a smaller, less computationally intensive Student model aims to replicate. EfficientAD detects anomalies through the following process:

- Feature Learning: Normal data is input into the Teacher model to extract high-dimensional features. These features serve as targets for the Student model to emulate.
- Imitative Learning: The Student model is trained to reproduce the features extracted from the Teacher model. This process enhances inference speed due to the lightweight design of the model.
- Anomaly Detection: Evaluates whether the Student model outputs different features compared to the Teacher model when testing data is input, calculating the difference as an anomaly score. Large differences indicate anomalies.
Lightweight Model Design and Its Advantages
EfficientAD offers the following advantages due to its lightweight model design:
- Fast Inference: The Student model's low computational requirements allow for real-time anomaly detection, enabling immediate responses to anomalies in industrial production lines.
- Low Memory Consumption: With fewer model parameters, memory usage is reduced, facilitating operation on embedded systems and mobile devices.
- Adaptability: The lightweight design enables rapid adaptation to different applications and environments.
EfficientAD has demonstrated high precision and efficiency in experiments using the MVTec AD dataset compared to traditional anomaly detection methods. The Teacher-Student model design, in particular, has the potential to set new standards in the field of anomaly detection.
Future of Anomaly Detection
Anomaly detection technology is expected to continue evolving in various directions. Here are some of the expected developments:
- Further Utilization of Deep Learning: Advanced deep learning model development will continue, expanding the precision and applicability of anomaly detection.
- Self-Learning and Adaptive Models: Technologies that allow models to automatically learn and adapt to changes in anomaly patterns will become crucial.
- Integration of Anomaly Detection and Big Data: The construction of systems that utilize big data from IoT devices and sensor networks to perform real-time anomaly detection will advance.
The evolution of anomaly detection technology will be key to enhancing safety and efficiency in industries and everyday life. New technologies and approaches are expected to continually emerge, making it a challenging and ongoing field of study for researchers and engineers.
References
- MVTec-AD: https://www.mvtec.com/company/research/datasets/mvtec-ad
- SPADE: https://arxiv.org/abs/2002.10445
- Gaussian-AD: https://arxiv.org/pdf/2005.14140.pdf
- PaDiM: https://arxiv.org/pdf/2011.08785.pdf
- PatchCore: https://arxiv.org/abs/2106.08265
- AutoEncoder SSIM: https://arxiv.org/abs/1807.02011
- EfficientAD: https://arxiv.org/abs/2303.14535